-
Family life and community life
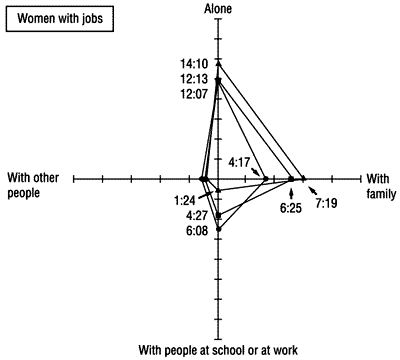
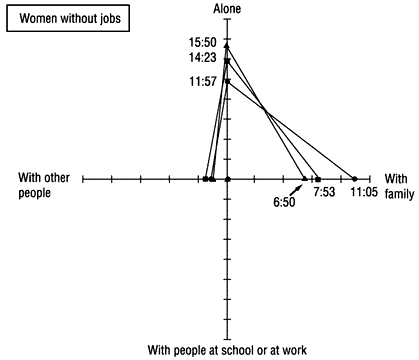
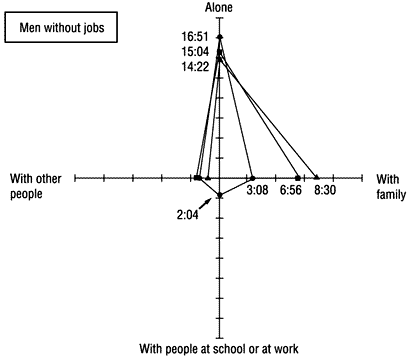
With whom did you spend your time?
Whom people spent their time with during the course of a day's activities was examined in three age brackets - 25-29 years, 45-49 years, and 65 years and above - and according to gender and state of employment. Results revealed significant changes according to the age bracket (Figure 18).Figure 18: Who did you spend your day with?

Notes:
- This figure looks at how much overall average time is spent in one day and with whom (alone, with family, with people at work or at school, with other people) in primary activities (sleeping, general chores, eating), secondary activities (commuting to school or work, work, household chores, etc.) and tertiary activities (hobbies, volunteer activities, etc.).
- "Men or women with jobs" refers to those who as a general circumstance work on a continuous basis to receive compensation, and includes those who work on the side at home in addition to doing housework and those who work on the side while attending school. "Men or women without jobs" refers to those outside the category of "employed."
Source:
Compiled from 1996 Survey on Time Use and Leisure Activities, Management and Coordination Agency
-
Families
More frequent late marriages
More than 70% of respondents either agreed or generally agreed that marriage was a personal choice, so individuals could marry or not marry as they saw fit.As attitudes toward marriage become more flexible, the average age for first marriages for both men and women has been rising in recent years.
The most popular reason among women (close to 70%) for late marriages was that more women are working and have greater economic power, while more than 50% felt that a single life offered more freedom. The most popular reason among men (close to 60%) for late marriages was that a single life offered more freedom (Figure 19).
Figure 19: Attitudes on late marriages (multiple response)
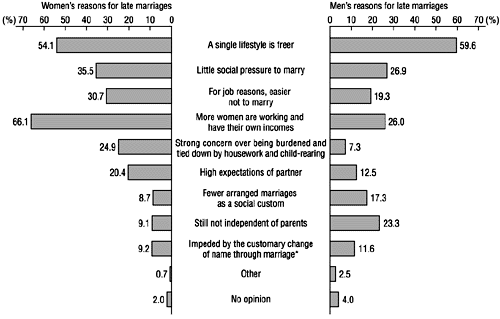
*Because fewer children are being born, with more families having only one child, the customary change of name through marriage is becoming a problem where families want to preserve the family name.
Source:
Compiled from Public Opinion Survey on Gender Equality (1997), Prime Minister's Office
Marriage brings major changes to women's division of time
Looking at how menユs and womenユs division of time changes before and after marriage, married women spend less time on work, etc., while there is a marked increase in the amount of time consumed by housework, etc. This results in more time spent on semi-compulsory activities as a member of society such as paid work and housework (secondary activities), with major changes accordingly caused in the division of womenユs time (Figure 20).Figure 20: How is time division changed by marriage?
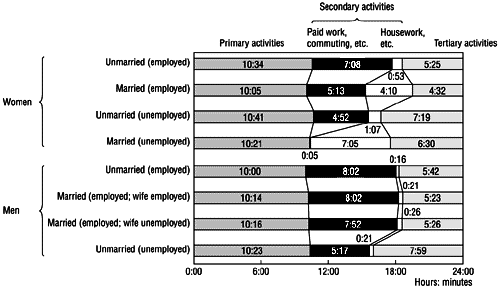
Notes:
- "Primary activities" include sleeping, general chores and eating. Of secondary activities, "work, commuting, etc." refers to commuting to school and work, work and study, while "housework, etc." refers to housework, family care and nursing, child-rearing and shopping. "Tertiary activities" includes hobbies and volunteer activities, etc.
- Married women are assumed here to have employed husbands.
Source:
Compiled from 1996 Survey on Time Use and Leisure Activities, Management and Coordination Agency
-
Equal participation in family life
Men work; women work and also do housework
Both women and men seem to share the attitude that women may work but housework and child-rearing must also be properly attended to; when compared with survey results on the same subject in 1992, this tendency has in fact grown stronger. This consciousness among both men and women of "men working and women working and also doing housework" as the new division of gender roles seems likely to be placing a burden on working women in particular (Figure 21).Figure 21: On the notion that women may work, but that housework and child-rearing should be properly attended to
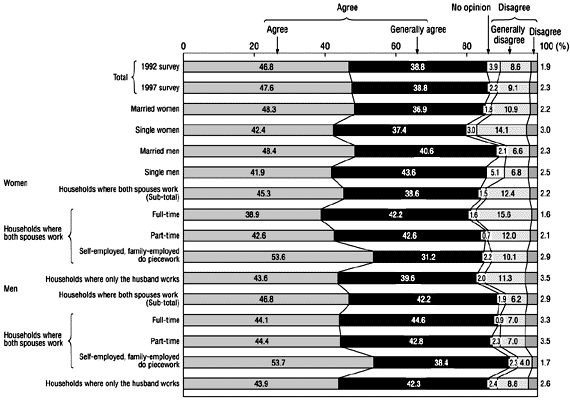
Notes:
Households where both spouses work are indicated either in the sub-totals or by the type of employment in which the wife is engaged.
Source:
Compiled from Public Opinion Survey on Gender Equal Society (1997), Prime Minister's Office
No changes in couple's division of time
Figure 22 compares the division of time for couples in households where both spouses have paid work with households where the wife is a full-time housewife and the husband has paid work.Comparing men's division of time in 1986 with that in 1996, time reduced from paid work and commuting, etc., is being spent on primary and tertiary activities rather than housework, etc., with the result that within secondary activities, the amount of time spent by women and men respectively on paid work, etc., and housework, etc., has remained virtually unchanged (Figure 22).
Figure 22: Couples' use of time
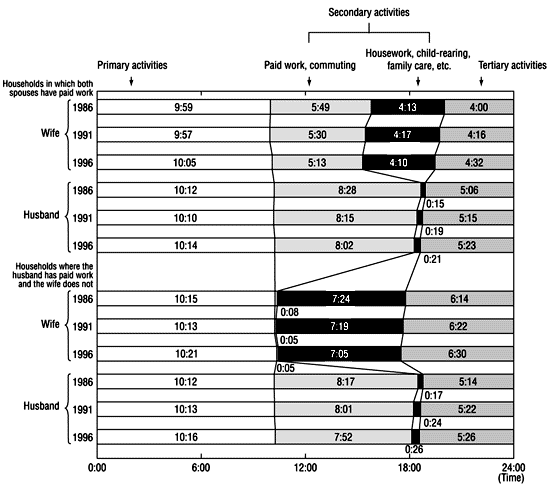
Notes:
Primary activities" include sleeping, eating, etc., which are physiologically necessary for human beings. "Secondary activities" constitute semi-compulsory activities as a member of society such as paid work and housework. "Tertiary activities" refer to activities other than primary and secondary activities which are carried out in one's free time. "Housework, child-rearing, family care, etc." include nursing and shopping.
Source:
Compiled from Survey on Time Use and Leisure Activities (1986, 1991 and 1996), Management and Coordination Agency
Necessary elements in promoting men's participation in housework, child-rearing and education, etc.
In terms of what is needed to promote men's participation in child-rearing, housework and education, etc., a growing number of respondents feel that in addition to the importance of opportunities for individual couples to discuss and decide on their respective roles, changes in the modes of thought and practices, etc., of society as a whole would also have an impact on determining the division of roles in individual households (Figure 23).Figure 23: What is needed in order for men to participate in housework, child-rearing and education, etc. (multiple response)
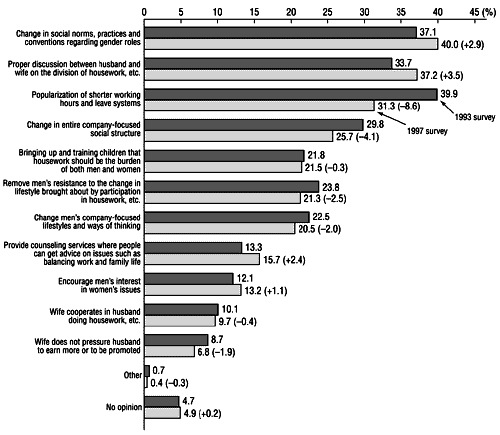
Notes:
Figures within parentheses indicate the change in statistical values compared to the 1993 survey.
Source:
Public Opinion Survey on Gender Equal Society (1997), Prime Minister's Office
An increasingly aged society
As of 1 October 1997, 19.76 million of Japan's total population of 126.17 million were aged 65 years and above. Senior citizens therefore now comprise 15.7% of Japan's total population (aging rate).Looking at aging rates by prefecture, Shimane Prefecture has the highest rate, at 26.4% for women and 19.4% for men, followed by Kochi Prefecture (24.9% for women and 18.4% for men), Akita Prefecture (24.0% for women and 18.1% for men) and Yamagata Prefecture (24.3% for women and 17.8% for men).
Elderly households
Looking at elderly households (those comprising only men of 65 years and above and women of 60 years and above, including unmarried household members under 18) by prefecture, rates seem to be higher overall in west Japan (Figure 24).Figure 24: Ratio of elderly households to total households (by prefecture)
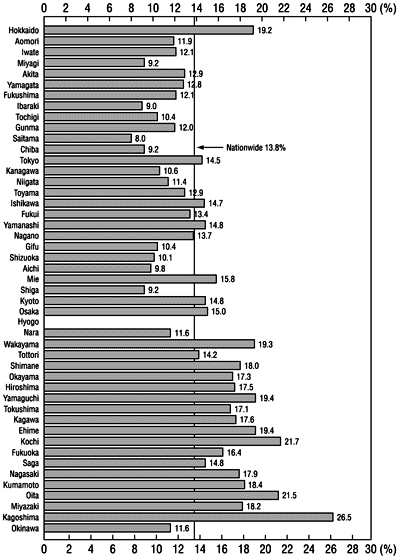
Notes:
- Hyogo Prefecture has not conducted this survey.
- "Elderly households" refers to those households comprising only men of 65 and over and women of 60 and over, or such elderly households where single persons under 18 are also in residence.
Source:
Comprehensive Survey of Living Conditions of the People on Health and Welfare (1995), Ministry of Health and Welfare
Care of parents and spouses
In terms of who should care for parents and spouses when care becomes necessary, a high ratio of those in the "elderly" bracket felt that families and relatives should take on this task. By region, the ratio of those who felt it was the responsibility of family and relatives was comparatively high in the Tohoku and Chugoku regions, etc. (Figure 25).Figure 25: Nursing where a family member becomes bed-ridden
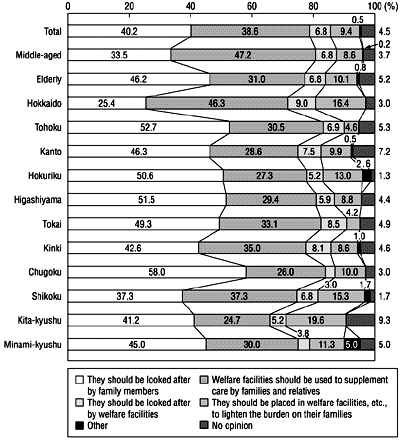
Notes:
- "Middle-aged" refers to those between 40 and 59, while "elderly" refers to those 60 and above.
- The total is calculated from total replies from both the "middle-aged" and the "elderly" categories.
- The survey divides responses from 1,392 men and women of 60 years and above from around the country by region. "Hokuriku" includes Niigata, Toyama, Ishikawa and Fukui Prefectures, while "Higashiyama" includes Yamagata, Nagano and Gifu Prefectures, and "Tokai" covers Shizuoka, Aichi and Mie Prefectures.
Source:
Compiled from Survey on Awareness of Aging Issues among the Middle-Aged and Elderly (January 1998), Management and Coordination Agency
Time spent on care
Of those 15 years and above, around 3.7 million people (3.6% of the total population of 15 years and above), are involved on a daily basis in family care and nursing, of which around 2.35 million are women (around 4.4% of the total population as defined above) and 1.35 million are men (around 2.7% of the total population as defined above). The number of those nursing or caring for family members of 65 years and above has also risen to around 2.86 million.Overall, women are spending more time than men on nursing and care (Figure 26).
Figure 26: Ratio of those engaged in family care or nursing and the time given to this (average time per day)
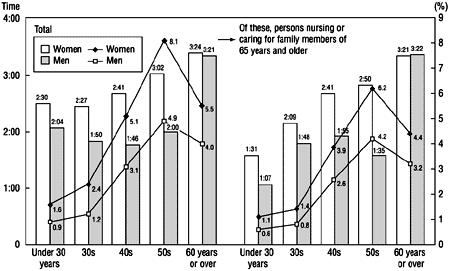
Notes:
- People surveyed were 15 years or older.
- The ratio (line graph) comprises those persons surveyed who were engaged in nursing or caring for family members.
- The time (bar graph) refers to the average amount of time spent by those who, of all those usually involved in nursing or caring for family members, were actually doing so on the day of the survey.
Source:
1996 Survey on Time Use and Leisure Activities, Management and Coordination Agency
-
Gender equality in the community
Participation in social activities by prefecture
Looking at the ratio of persons who are engaged in social activities over the previous year, where the activity rate was high for men, it also tended to be high for women (Figure 27).Figure 27: Men's and women's participation rates in social activities
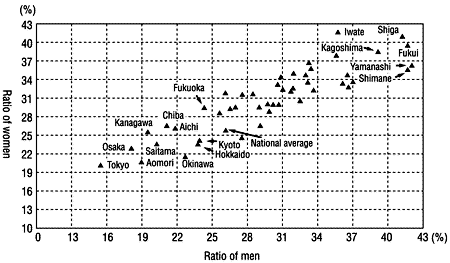
Notes:
This graph shows by prefecture the rate of women participating in social activities on the vertical axis and the rate of men on the horizontal axis. "Participant rates" refers to the ratio of the population of 10 years and older who are involved in social activities in the various prefectures. "Social activities" refers to the act of providing one's own efforts, time, knowledge or skill for society or community without receiving remuneration.
Source:
Compiled from 1996 Survey on Time Use and Leisure Activities, Management and Coordination Agency
Women's participation in decision-making processes in the community
In terms of women's participation in the decision-making processes in groups working in communities, the ratio of women varies greatly according to the type of group, with women leading more than 40% of child-related groups, with low ratios continuing in neighborhood councils and commercial groups (Figure 28).Figure 28: Sex of Chairpersons (by type and by age group)
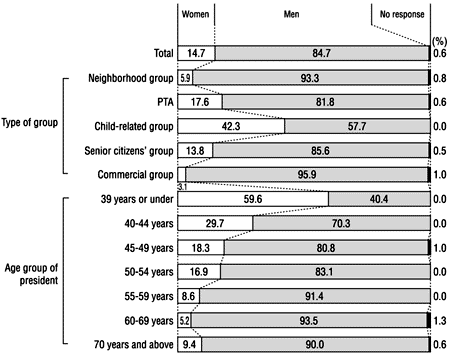
Notes:
"Neighborhood group" refers to neighborhood groups and town meetings; "PTA" refers to PTAs and parents' associations; "child-related group" refers to child-related groups and education associations; and "commercial group" refers to commerce-related organizations.
Source:
Survey on Gender Equality in Local Groups (December 1996), Tokyo Metropolitan Government
Cabinet Office Home > Gender Equality Bureau Cabinet Office > Gender Equality in Japan > White Paper > The Present Status of Gender Equality and Measures > The Present Status of Gender Equality and Measures
The Present Status of Gender Equality and Measures
- Main Policies
- Positive Action
- Expansion of Women's Participation in Policy and Decision-making Processes in All Fields in Society
- Work-life Balance for Men and Women
- Elimination of All Forms of Violence against Women
- Support for the Promotion of Gender Equality in Regions
- Gender Equality and Disaster Risk Reduction
- Male Leaders Coalition for Empowerment of Women
Tel: +81-3-5253-2111
JCN : 2000012010019
Copyright 2016 Gender Equality Bureau Cabinet Office.